


 4 / 32

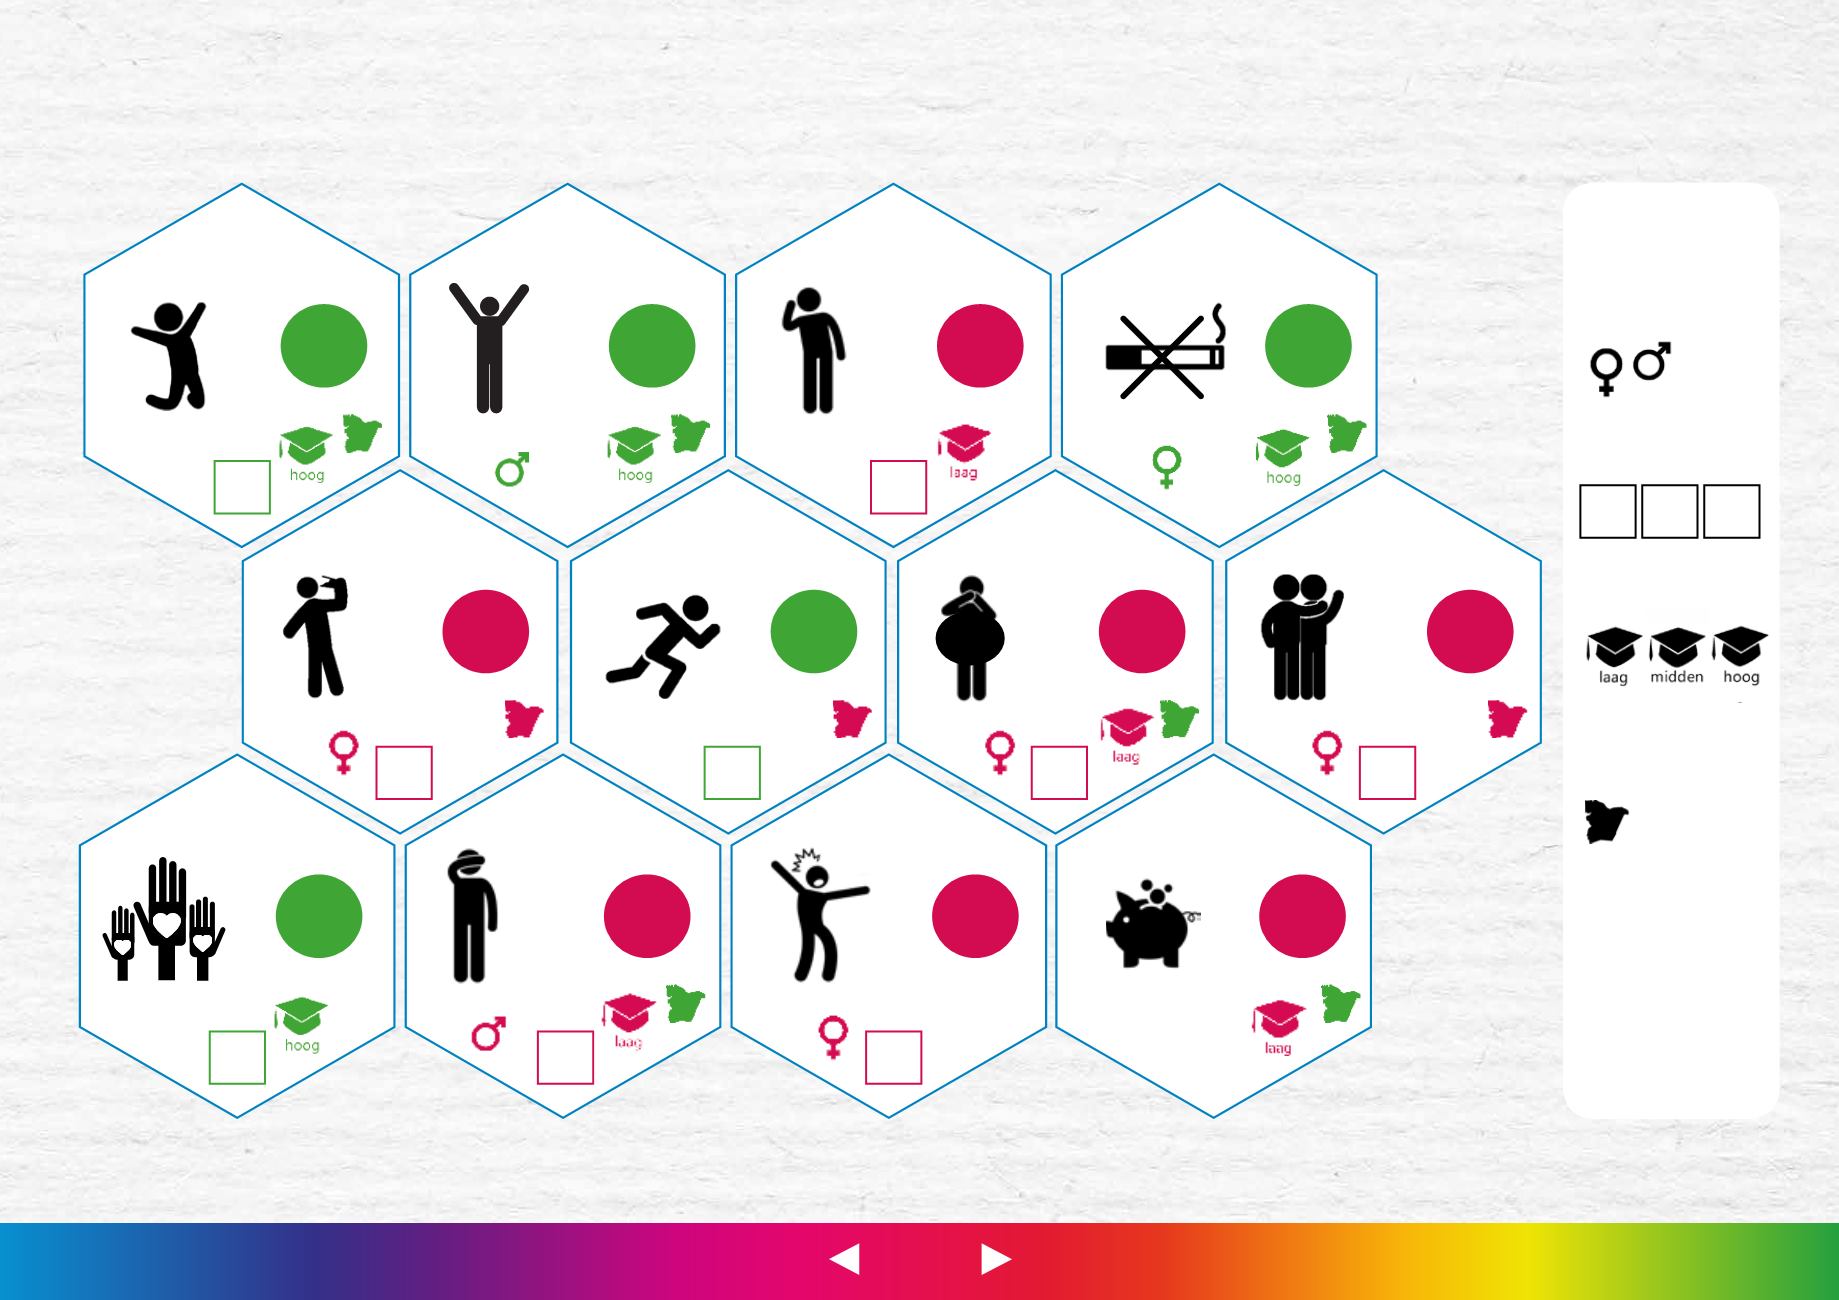
2016
Verschil met 2012
Geslacht
Leeftijd
Opleiding
Regio t.o.v. NL
Rood = ongunstiger
Groen = gunstiger
=
=
gelijk
nb
=
niet bekend
Volgende pagina:
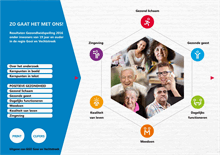
KERNPUNTEN IN BEELD:
OUDEREN
Kies een ander onderwerpKERNPUNTEN IN BEELD: VOLWASSENEN
19
tm
34
35
tm
49
50
tm
64
(Zeer) goed
ervaren gezondheid
Goed
in je vel
Lichamelijke
beperking
Rookt
niet
82%
61%
9%
81%
19
tm
34
50
tm
64
2016
2016
2016
Overmatig
alcohol
Beweegt
gezond
Ernstig
overgewicht
Geeft
mantelzorg
22%
55%
9%
12%
50
tm
64
50
tm
64
50
tm
64
50
tm
64
Doet
vrijwilligerswerk
Sociaal
eenzaam
Slachtoffer
van huiselijk geweld
Moeite met
rondkomen
30%
37%
10%
18%
50
tm
64
50
tm
64
19
tm
34
2016
=
=
=
=
=
=
=
=
=
=
=
=
=
=
=
=
= =
=
=
nb
nb
nb